In an era where the digital landscape is saturated with information, the ability to present data and concepts visually is more crucial than ever. Enter Text2Infographic, an innovative tool that harnesses the power of AI to effortlessly convert text into captivating infographics. Designed for speed and simplicity, Text2Infographic allows users to transform dense blocks of text into visually engaging content without any prior design skills. Whether you are a marketer looking to enhance your content marketing strategy or an educator creating materials for students, this tool offers an intuitive solution for generating infographics in a matter of minutes. The capabilities of Text2Infographic go beyond just aesthetics; they bring clarity and comprehension to complex ideas, making it an invaluable asset for anyone who needs to present information clearly and effectively.
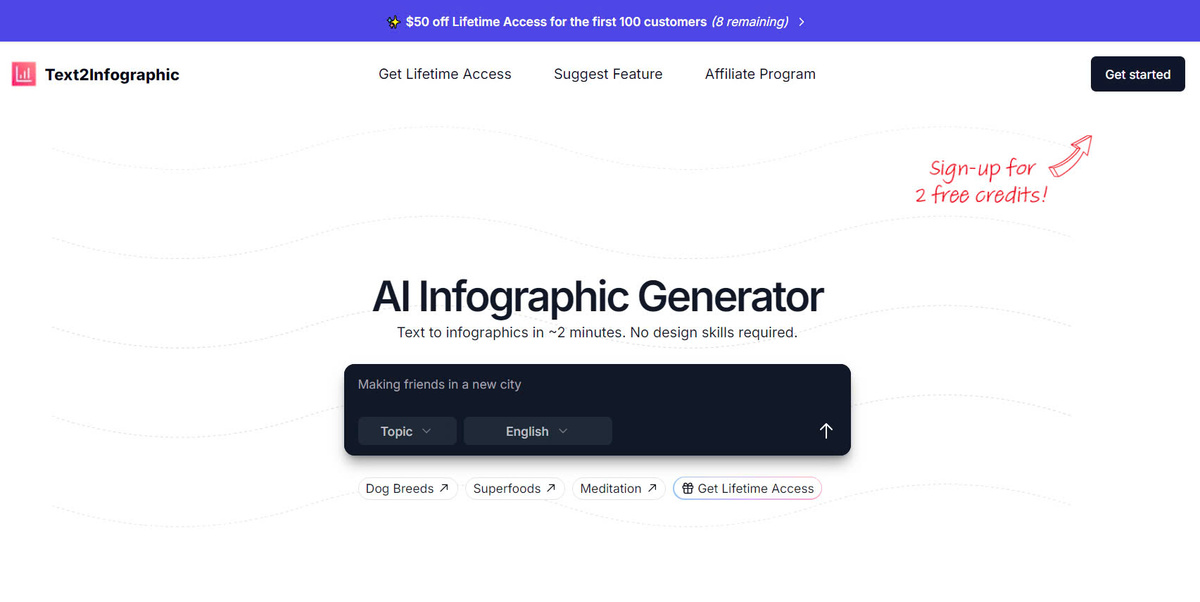
What is Text2Infographic?
The fundamental purpose of Text2Infographic is to deliver a seamless experience in transforming textual information into visually appealing graphics. By leveraging advanced AI algorithms, this tool can analyze inputted text and intelligently select relevant visuals that best convey the intended message. This means you don’t need to be a design expert to create stunning infographics. Instead of grappling with complicated software and endless design options, Text2Infographic simplifies the entire process, allowing you to focus on your message rather than the technicalities of design.
Creating infographics has never been easier—simply input your text, and within moments, Text2Infographic will generate a professionally designed infographic tailored to your needs. This not only saves time but also ensures consistency and quality across your visual content. The quick turnaround from text to infographic makes it ideal for urgent projects or tight deadlines, enabling users to produce high-quality visuals swiftly.
Speed and Simplicity
When we talk about speed and simplicity, we refer to the core functionalities that set Text2Infographic apart from traditional design methods.
Immediate Output: One of the most significant advantages of using Text2Infographic is its immediate output. Users can quickly type out their thoughts, arguments, or data points, and almost instantaneously receive a finished product that looks polished and professional. This seamless transition from raw text to finished infographic allows for rapid prototyping of ideas, which is especially beneficial in fast-paced work environments.
User-Friendly Interface: The user-friendly interface is designed with the non-designer in mind. There’s no steep learning curve or complicated navigation; instead, users can easily navigate through the platform as if they were using a word processor. This accessibility encourages more individuals to engage with visual content creation, ultimately broadening the scope of who can utilize infographics in their work.
Visual Appeal for Various Purposes
A picture is worth a thousand words, and in content creation, this axiom rings especially true. Infographics serve as a bridge between complex information and audience comprehension. With Text2Infographic, users can create visuals that cater to different purposes, whether it's for educational materials, marketing campaigns, business presentations, or social media posts. The flexibility in application means that anyone—from educators to marketers—can benefit from incorporating infographics into their communication strategies.
In essence, Text2Infographic is more than just a tool; it is a gateway to effective communication and enhanced understanding. As businesses and individuals continue to recognize the importance of visual storytelling, tools like Text2Infographic will become indispensable in crafting compelling narratives that resonate with audiences.
Why Choose Text2Infographic?
As the demand for visual content continues to grow, choosing the right tools to facilitate the creation of such content is essential. Here are several compelling reasons why Text2Infographic stands out among its competitors.
Save Time and Effort on Infographic Creation
Time is often the most limited resource in any project, and Text2Infographic addresses this concern head-on. By automating the infographic creation process, the tool significantly reduces the time required to convert ideas into visual formats.
Efficiency at Its Best: Not only does this automation save time, but it also frees up mental bandwidth. Content creators can focus on refining their messages rather than getting caught up in the minutiae of design, resulting in higher-quality outputs. For instance, a blog writer can spend less time formatting and more time crafting compelling narratives, all while knowing that their insights will be represented visually in an eye-catching manner.
Rapid Idea Iteration: With Text2Infographic, you can iterate ideas rapidly. As soon as you have a new thought or piece of information, you can input it into the system and visualize it almost instantly. This rapid iteration is particularly valuable during brainstorming sessions or collaborative projects, where team members can quickly evaluate different visual representations of ideas.
Enhance Content with Engaging Visuals
Visuals play a crucial role in capturing and retaining the audience's attention. Studies show that people are more likely to remember information presented visually compared to plain text.
Engagement Boost: Using infographics increases viewer engagement by breaking down complex information into digestible pieces. When users leverage Text2Infographic, they’re not just presenting data—they're enhancing the overall experience for their audience. The presence of engaging visuals encourages viewers to absorb information more readily, leading to improved retention and understanding.
Complementing Written Content: Moreover, infographics serve to complement written content effectively. They can summarize long articles, highlight key statistics, or illustrate step-by-step processes, ensuring that readers grasp essential points without feeling overwhelmed by excessive text. This synergy between written and visual content strengthens overall messaging.
Improve Information Comprehension and Retention
Another significant advantage of utilizing infographics generated through Text2Infographic lies in their ability to improve comprehension and retention of information.
Cognitive Processing: Our brains naturally favor visual information as it aligns with how we process and understand concepts. Infographics enable content creators to leverage cognitive psychology principles to make complex data more relatable. Rather than bombarding audiences with numbers and text, presenting this information graphically simplifies cognitive processing, allowing people to grasp ideas at a glance.
Long-lasting Impact: Additionally, the memorable nature of well-designed infographics can lead to longer-lasting impacts on audiences. People are more likely to recall visual information days or even weeks later, making it an effective strategy for reinforcing knowledge and promoting brand recognition. For brands aiming to establish themselves in competitive markets, this memorability can translate into better customer relations and increased loyalty.
No Design Skills or Software Required
A common barrier to entry when creating infographics is the requisite design skills and software knowledge. However, Text2Infographic breaks down these barriers completely.
Democratization of Design: By eliminating the need for advanced design software or expertise, Text2Infographic democratizes the infographic creation process. Anyone, regardless of their background, can create visually appealing graphics that communicate ideas effectively. This opens up opportunities for those who may have previously felt deterred from producing visual content due to a lack of artistic talent.
Accessibility for All: In today’s digital age, accessibility is paramount, and Text2Infographic caters to this need. It makes powerful infographic creation accessible to everyone, from seasoned professionals to students embarking on their academic journeys. This broad appeal ensures that individuals and organizations can leverage the power of visual content to enhance their communications.
Affordable and Accessible to Everyone
Affordability is another important consideration when selecting tools for content creation. Text2Infographic prioritizes accessibility, ensuring that users can create impressive visuals without breaking the bank.
Cost-Effective Solutions: Many graphic design tools come with hefty price tags and subscription fees. In contrast, Text2Infographic provides cost-effective solutions, allowing businesses and individuals to invest their resources more wisely while still achieving high-quality results. This benefit is particularly relevant for startups and small businesses looking to make an impact without incurring significant costs.
Trial Options: Moreover, the availability of trial options gives users a risk-free opportunity to explore the tool's features before committing financially. This level of transparency fosters trust and encourages more individuals to adopt the tool for their visual content creation needs.
Overall, Text2Infographic is positioned as an exceptional solution for those seeking to create engaging infographics quickly and affordably. The benefits of time savings, enhanced engagement, improved comprehension, accessibility, and affordability collectively establish it as a go-to tool for anyone invested in effective content marketing and communication.
II. Main Features of Text2Infographic
The real power of Text2Infographic lies in its robust feature set designed to streamline the infographic creation process. Each feature contributes to simplifying the workflow while maximizing creativity and customization.
Text-to-Infographic Conversion
At the heart of Text2Infographic is its incredible capability to convert text into infographics seamlessly.
Inputting Text: To get started, users simply input their desired text into the designated field. The AI algorithm analyzes the text to identify key themes, important data points, and overall context. This initial analysis sets the foundation for generating a visually coherent and relevant infographic that encapsulates the essence of the input material.
AI Analysis and Relevant Visuals: The AI takes the user’s text and selects suitable visuals that align with the message being conveyed. This process involves identifying graphics, charts, icons, and patterns that can enhance the understanding of the information provided. Such intelligent curation is vital because it ensures that each infographic is not only visually appealing but also aids comprehension—making the viewer's experience richer and more informative.
Customizing Layout: Users can also customize the layout to achieve the look that resonates with their branding or personal style. Adjustments can be made to the arrangement of elements, ensuring that the final product meets specific presentation requirements. This level of customization empowers users to tailor their infographics precisely according to their objectives.
Customization Options
Customization is a hallmark of creative expression, and Text2Infographic offers a range of options that allow users to infuse their personality or brand identity into each infographic.
Fonts, Colors, and Styles: Text2Infographic comes equipped with various fonts, color palettes, and design styles that users can choose from. The ability to adjust font styles and sizes adds character and helps reinforce the tone of the content. Additionally, color schemes can be personalized to coordinate with a brand’s visual identity, ensuring consistency across different platforms.
Icons and Images: Beyond text and colors, the platform provides users access to a library of high-quality icons and images that can elevate the infographic’s appeal. These visuals add depth and meaning to the content, allowing users to express their ideas creatively. The thoughtful integration of icons and images further enriches the narrative, drawing the viewer's eye and enhancing engagement.
Templates and Styles
One of the standout features of Text2Infographic is its extensive library of pre-designed templates and styles tailored for various purposes.
Pre-Designed Templates: These templates offer a solid starting point for users, reducing the time spent on design decisions. They encompass a wide range of industries and topics, making it easier for users to find designs that fit their specific use case. Whether the goal is to create an educational infographic, a marketing piece, or a data report, there’s a template available to suit every need.
Choosing Based on Content: The templates are categorized based on content type, allowing users to filter options accordingly. This feature streamlines the selection process, enabling users to identify templates that will help them achieve their goals efficiently. Furthermore, once a template is chosen, it can be customized further to ensure that it maintains a unique identity while benefiting from the structural advantages of the original design.
Image and Icon Library
An impressive aspect of Text2Infographic is the extensive library of images and icons that users can incorporate into their infographics.
High-Quality Visuals: Quality matters when it comes to visual content, and Text2Infographic delivers with access to a vast collection of high-resolution images and professionally designed icons. These visuals are not only aesthetically pleasing but also relevant and appropriate for various contexts, promoting a cohesive look throughout your infographic.
Enhancing Infographics: Integrating images and icons enhances the storytelling aspect of infographics. By using visuals that resonate with the content, users can make their points clearer and more impactful. Icons can simplify complex ideas, while images can evoke emotions or illustrate concepts effectively. Ultimately, these elements serve to strengthen the overall message conveyed by the infographic.
Export and Sharing
Once your infographic is complete, Text2Infographic simplifies the export and sharing process, making it easy to distribute your creations across various platforms.
Export Options: Users can download their completed infographics in multiple formats, including PNG, JPG, and PDF. This flexibility ensures that infographics can be used in various contexts, from digital presentations to printed materials. The choice of format also allows users to prioritize quality and resolution based on their specific needs.
Ease of Sharing: Sharing your infographic is equally straightforward. Text2Infographic includes options for direct sharing on social media platforms, enabling users to promote their visuals and reach wider audiences with minimal effort. This functionality is particularly beneficial for marketers and brands aiming to increase engagement and visibility through visual content.
In summary, the main features of Text2Infographic combine to create an efficient, user-friendly experience for anyone wishing to produce high-quality infographics. From the initial text conversion process to customizable layouts and export options, every aspect is designed to empower users and foster creativity in conveying their messages visually.
III. Text2Infographic Pricing
| Feature | Lifetime Access |
|---|---|
| Price (USD) | $70 (Normally $120) |
| Unlimited Infographics | ✓ |
| Full Commercial Rights | ✓ |
| Blog to Infographic | ✓ |
| Automatic Topic Research | ✓ |
| Citations | ✓ |
| Customize Logos | ✓ |
| Lifetime of updates | ✓ |
Notes:
- This is a one-time purchase for lifetime access.
IV. Text2Infographic Application
With its diverse capabilities, Text2Infographic finds beneficial applications across various sectors and use cases. Understanding how this tool can be utilized effectively will help users maximize its potential.
Use Cases
The versatility of Text2Infographic makes it suitable for a wide array of applications, catering to different audiences and goals.
Blog Posts and Articles: Content creators and bloggers can enhance their written articles with visually striking infographics summarizing key takeaways, presenting statistics, or illustrating processes. Infographics can serve as standalone pieces within the blog post or as additional supporting content, capturing readers’ attention and encouraging them to engage more deeply with the material.
Social Media Sharing: In the age of social media, eye-catching visuals are paramount. Text2Infographic allows users to create shareable infographics tailored to various platforms, such as Instagram, Facebook, or LinkedIn. High-quality visuals stand out in crowded feeds, increasing the likelihood of shares and interactions, thereby boosting the reach of messages.
Presentations and Reports: Professionals crafting presentations or reports can leverage infographics to break down complex data and organize information logically. Infographics can provide visual summaries that enhance audience understanding and retention, allowing presenters to communicate their key points more effectively.
Successful Customer Stories
Numerous users have successfully integrated Text2Infographic into their workflows, resulting in remarkable outcomes.
Case Study: Marketing Agency: A marketing agency utilized Text2Infographic to create infographics for client campaigns. By streamlining their infographic creation process, they were able to deliver visually compelling content that resonated with target audiences. One notable campaign resulted in a 50% increase in social media engagement, showcasing the effectiveness of visually-rich content in attracting attention.
Case Study: Educator: An educator employed Text2Infographic to develop teaching materials for her classroom. Infographics helped simplify complex subjects, garnering positive feedback from students who found the visuals easier to understand. The educator reported a noticeable improvement in student engagement and performance, emphasizing the impact of visual learning aids.
Benefits of Using Infographics for Different Content Marketing Goals
Using infographics created via Text2Infographic brings tangible benefits to content marketing efforts.
Improved Shareability: Infographics are inherently shareable, making them perfect for spreading awareness about a brand or topic. As audiences interact with and share engaging visuals, the potential for organic reach expands exponentially.
Enhanced Brand Recognition: Consistently producing high-quality infographics establishes authority and reinforces brand identity. Over time, viewers begin to associate certain visual styles and messaging with the brand, leading to increased recognition and loyalty.
In conclusion, the practical applications of Text2Infographic showcase its value in various settings. By embracing infographics as a form of visual communication, users can elevate their content marketing strategies and resonate with their audiences on a deeper level.
V. Target Audience
Understanding the target audience for Text2Infographic is critical to recognizing its full potential and applicability. This is a tool designed for a diverse group of individuals and organizations, each with unique needs and challenges.
Content Creators and Marketers
Professional Growth and Development: Content creators, including writers, marketers, and social media managers, rely heavily on visual content to enhance their projects. With Text2Infographic, they can produce infographics swiftly, amplifying their creative output and allowing them to expand their repertoire of visual techniques.
Strategic Communication: For marketers, infographics play a pivotal role in communication strategies. Companies can use them to present campaign results, showcase brand stories, and explain product features. The ability to create attractive visuals without needing design expertise levels the playing field, enabling marketers to focus on strategic messaging that drives results.
Educators and Students
Teaching Tools: Educators face the challenge of making complex subjects engaging and comprehensible. Infographics provide an excellent way to visualize intricate topics, facilitating better understanding among students. Text2Infographic enables teachers to create custom learning materials that keep students engaged and improve retention.
Student Projects: Students can also benefit from using Text2Infographic for assignments and projects. Instead of submitting standard essays, they can present their findings visually, adding a unique touch that showcases their understanding of the material. This approach encourages creativity and innovation among students, fostering a deeper connection to their studies.
Businesses and Organizations
Internal and External Communication: Businesses can utilize infographics for both internal reporting and external communication. Internally, departments can create visual summaries of key metrics, projects, and initiatives, improving clarity and collaboration. Externally, companies can share infographics as part of their PR strategy, enabling them to present data-driven insights compellingly.
Client Engagement: For consulting firms and service providers, infographics can be leveraged to distill complex analyses or recommendations into easily digestible visual formats. This engages clients more effectively, ensuring they grasp the significance of the insights being presented.
General Public
Wider Accessibility: Ultimately, Text2Infographic caters to anyone with a desire to create infographics. This includes hobbyists, community organizers, or individuals interested in raising awareness around specific causes. Regardless of skill level or profession, Text2Infographic empowers individuals to leverage visuals for storytelling and advocacy.
By addressing the diverse needs of its target audience, Text2Infographic proves itself as a versatile and invaluable tool for anyone looking to create engaging visual content. The adaptability and ease of use ensure that users from various backgrounds can harness the power of infographics to convey their messages effectively.
VI. Related Products/Alternatives to Text2Infographic
While Text2Infographic stands out in its own right, it’s essential to consider other products and alternatives available on the market that offer similar functionality.
Comparison
When evaluating alternatives like Canva, Piktochart, and Venngage, it becomes evident that each platform has its strengths and weaknesses.
Canva: Canva is a popular design tool known for its extensive stock library and drag-and-drop interface. However, unlike Text2Infographic, it doesn’t offer fully automated text-to-infographic conversion. Users may find themselves spending more time customizing designs instead of focusing on content development.
Piktochart: Piktochart specializes in infographic creation but may require users to possess some degree of design skill. Its advanced features are fantastic for experienced designers but can be overwhelming for beginners. Text2Infographic excels here by providing simplicity and speed, making it more accessible for those without prior design training.
Venngage: Venngage is another competitor that focuses on infographics. While it boasts numerous templates and customization features, it lacks the same level of AI automation seen in Text2Infographic. Users who prioritize efficiency may find Text2Infographic more appealing, given its ability to quickly generate infographics with minimal input.
Text2Infographic's Strengths
What truly sets Text2Infographic apart is its emphasis on AI-powered generation, speed, and ease of use.
No Design Skills Required: Unlike many design-focused platforms, Text2Infographic requires no prior design skills, making it an excellent option for anyone reluctant to dive into complex software. This inclusivity allows individuals and organizations alike to embrace visual content creation.
Rapid Outputs: The ability to generate infographics quickly is another significant advantage. In our fast-paced world, timing is everything. Text2Infographic enables users to create high-quality visuals on-demand, which can be particularly beneficial for meeting deadlines and responding to current trends.
Complementary Tools
In addition to Text2Infographic, several complementary tools can enhance the overall content creation and marketing workflow.
Writing Tools: Integrating writing tools like Grammarly or Hemingway can help ensure that the text inputted into Text2Infographic is clear and concise. Strong writing combined with visual representation creates a powerful communication strategy.
Graphic Design Software: While Text2Infographic handles the heavy lifting of infographic design, users might occasionally want to refine visuals further using graphic design software like Adobe Illustrator or Affinity Designer. This combination allows for deeper customization and sophistication if needed.
Social Media Scheduling Platforms: After creating infographics, scheduling them for social media publishing can be streamlined through scheduling platforms like Buffer or Hootsuite. This integration ensures consistent posting and maximizes audience engagement across different channels.
By exploring related products and complementary tools, users can build a comprehensive content creation ecosystem that leverages the strengths of Text2Infographic while enhancing overall workflow and productivity.
VII. Conclusion
In a world where visual content is increasingly pivotal to effective communication, Text2Infographic emerges as a game-changer for anyone looking to transform text into engaging infographics effortlessly. This AI-powered tool epitomizes speed, simplicity, and accessibility, allowing users from various backgrounds to create stunning visuals without requiring design expertise.
From time-saving benefits to improved information comprehension, Text2Infographic equips users with the tools necessary to enhance their content marketing strategies and resonate with their audiences. Its rich feature set, including text-to-infographic conversion, customization options, and a library of high-quality visuals, positions it as an invaluable asset for content creators, marketers, educators, and businesses alike.
As we navigate the evolving digital landscape, the art of conveying ideas visually will continue to be paramount. Embracing tools like Text2Infographic not only prepares individuals and organizations for success but also empowers them to communicate their messages effectively and authentically. Whether you're crafting a report, designing educational materials, or enhancing social media posts, Text2Infographic serves as the bridge between ideas and visual storytelling, making it an essential tool in today’s content-centric world.